What is this?
It's part public website, part private journal. Part almanac, part blog. Part experiment in web design/construction, part showcase of my work. I live on West 32 Street, and it's my view from here.
PUBLIC / PRIVATE
Can't get much more public than being on the World Wide Web, and the idea of potentially reaching people all over the world has a lot of appeal. At the same time, this is a way of keeping an informal record of what I do, places I go, things I see, hear, and read. I did this for years using hardbound sketchbooks, but now I want to make it digital. I want sounds and pictures and videos, not only words.
ALMANAC / BLOG
I've always been fascinated by how weather and temperature and light and dark are so much part of our world. That's why this journal is color-coded to reflect the temperatures where I live, Cleveland, Ohio.
COLORS
The background color for each month shows the historical average temperature for the month.
The background color of each day's block on the homepage shows the actual mean temperature for that day this year.
HOMEPAGE IMAGES
The height of the image for each day shows the time between sunrise and sunset. You'll notice that the images gradually get taller from December-June, and smaller from June-December. One minute = 3 pixels, not a whole lot bigger than the period at the end of this sentence.
HISTORY
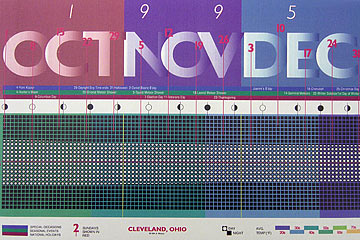
You can see that parts of this idea, including the temperature colors and showing the changing length of daylight hours, date back to one of my first grad school projects.
The assignment was to design a new kind of calendar. I decided to base mine on the change going on in the world around, so it shows not only temperatures and daylight, but phases of the moon.
 Three
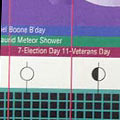
horizontal bands indicate historical events, natural events like meteor
showers, and national holidays. The start of each week is marked by a red
line and date.
Three
horizontal bands indicate historical events, natural events like meteor
showers, and national holidays. The start of each week is marked by a red
line and date.
My grad school career at Kent State was marked by a fair amount of frustration as I (at 45, with 20 yrs. experience) struggled to keep pace with my 25-35 yr. old classmates. This project was one of the few where I felt I'd really "nailed" it. It didn't happen often.
TOP
EXPERIMENT / SHOWCASE
As someone who teaches Web Design and Interactive Media (at Cuyahoga Community College) I need to keep learning new things. The first month of this journal (Jan. 2007) was created using tables for layout, a technique that's fallen out of favor in the web world. From February 2007 on I've been developing the site using CSS (Cascading Style Sheets). As soon as possible I plan to convert to a database-driven approach to content, so most of the formatting is handled automatically by the computer. This will include, I hope, a technique that automatically checks government weather statistics and inserts the proper temperature color each day.